The Science Behind Zenith
How we score, peer, value, and stress-test every company in the universe.
Advanced Peering System
Context-aware peer sets so valuation and risk comparisons reflect actual business similarity — not the sector label a classification vendor assigned five years ago.
Why It Matters
Standard industry codes (GICS, ICB) group companies by what they did when they were classified. APS groups them by what they look like today — combining fundamentals, price behavior, market structure overlap, and business descriptors to rank candidate peers by real similarity across multiple independent dimensions. Each dimension is normalized and weighted so no single factor dominates the match. The result is a comparison set that holds up when you actually run multiples against it.
Three Peering Methods
- Sector-based — same sector and industry classification. Default for fundamental benchmarking. Powers the Industry valuation model. Best when the sector is tight enough that traditional comps make sense.
- Theme-based — narrative similarity and shared price action patterns that cut across sector lines. When a company trades more like an AI play than a legacy enterprise vendor, theme peering captures that. Powers the Theme model.
- Similarity-based — comparable fundamental profiles (growth, margins, scale, business model) regardless of sector. Refines peer selection and builds the similarity network visualized in Benchmarking.
Peer Set Updates
Peer groups are not static. Sector classifications shift when companies pivot. Thematic linkages evolve with news flow and price co-movement. Similarity connections recalculate as fundamentals update. When the peer set changes, valuation outputs and benchmarking rankings shift with it.
For dataset coverage and update cadence, see Data Sources.
Why Traditional Comparisons Fall Short
Most platforms bucket companies by static industry codes and call it a peer group. You end up comparing a high-growth SaaS company against a legacy on-prem vendor because they share a GICS code. APS ranks candidates on actual fundamental and behavioral similarity before any comparison is made.
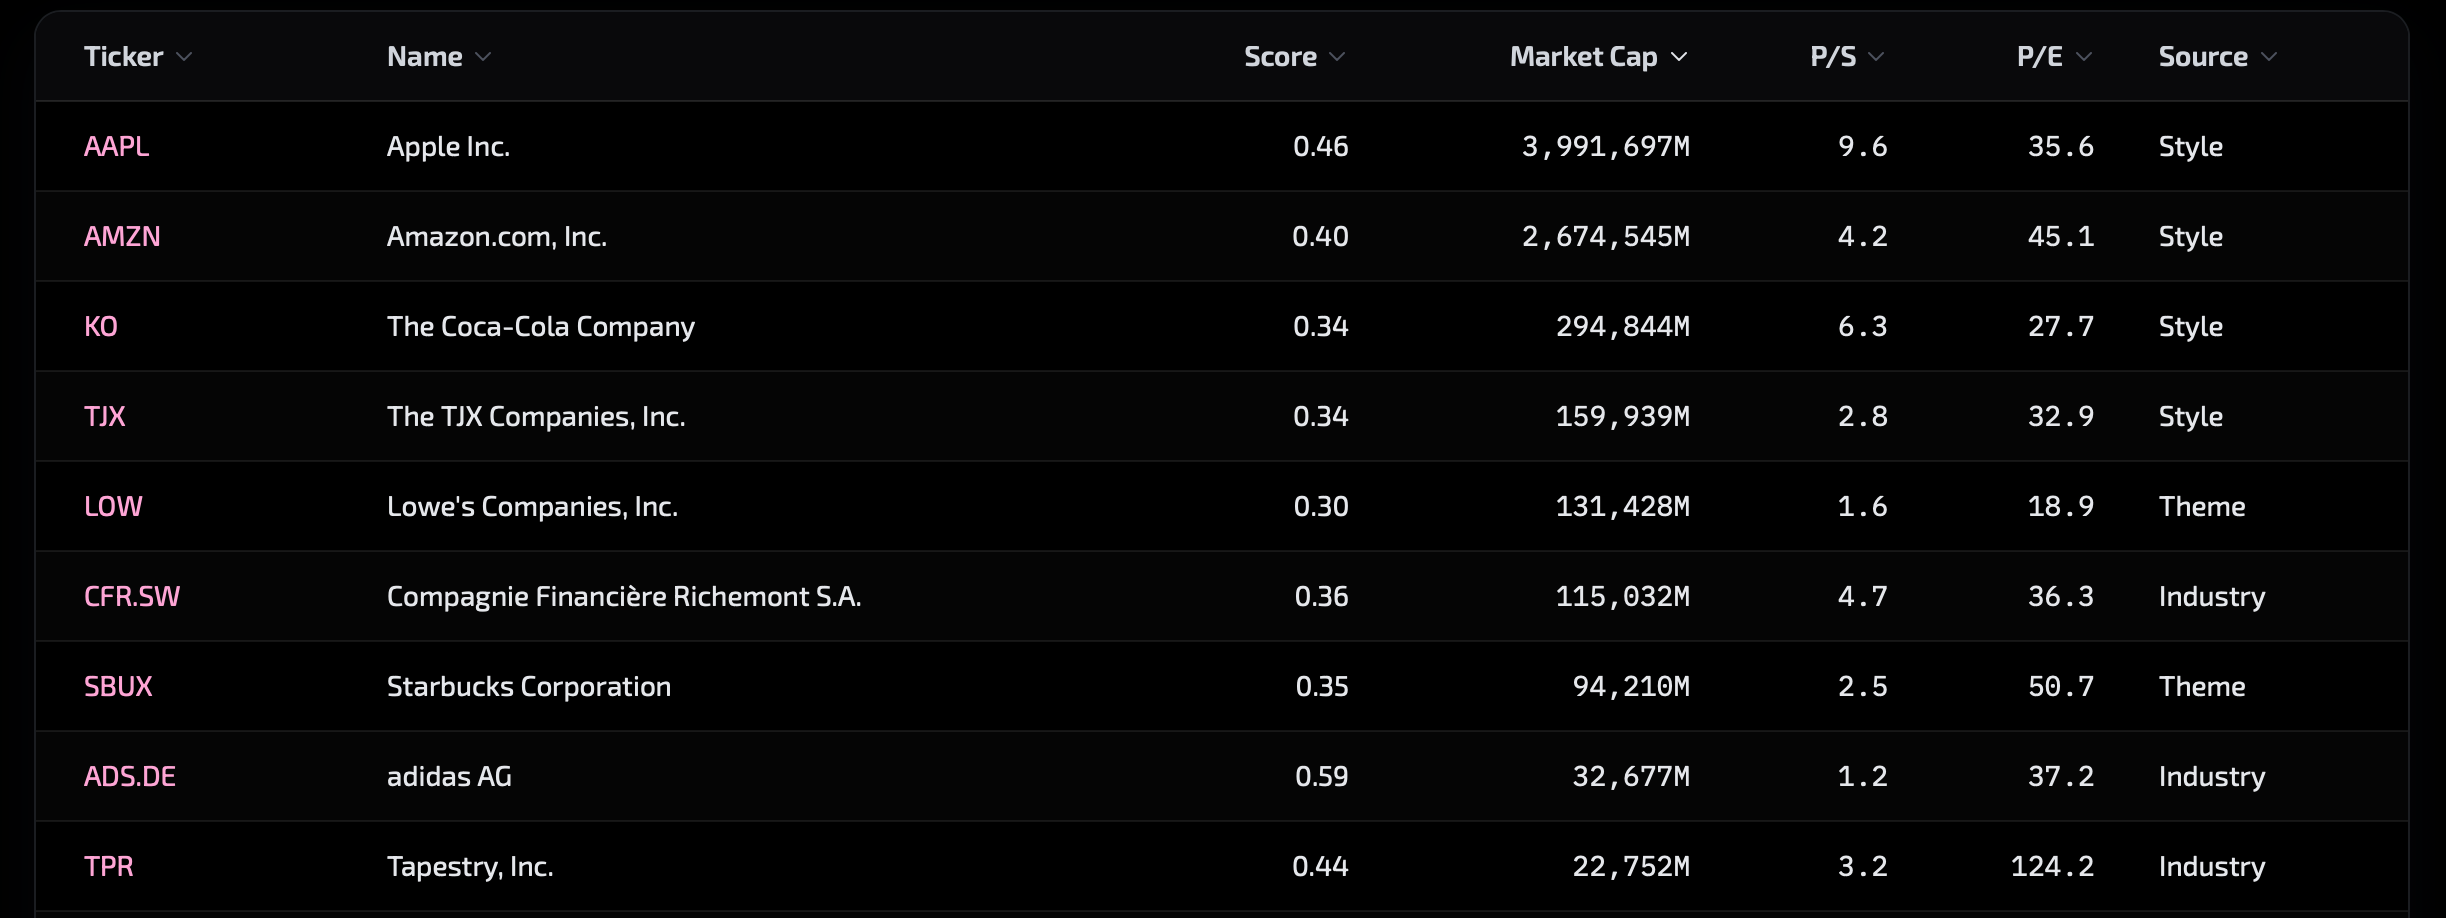
The peer table shows where a company ranks on each score dimension relative to its APS-selected comparables — not whoever happens to sit in the same sector bucket.
Zenith Scores
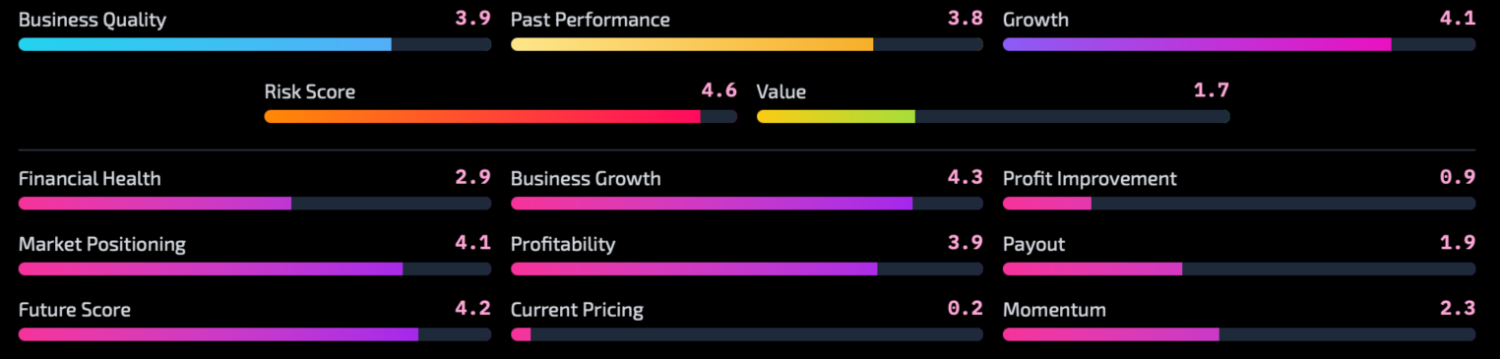
A multi-factor ranking system that evaluates every company across quality, growth, value, risk, and momentum — on a 0 to 5 scale. Higher scores indicate strength for Business Quality, Past Performance, Growth, and Value. For Risk, lower is better.
5 Main Scores
Each main score aggregates multiple components into a single dimension. For most dimensions, a score of 4–5 is strong, 2–3 is average, and 0–1 signals weakness. Risk is inverted: a low Risk score means the company carries less volatility, leverage, and drawdown exposure.
- Business Quality — Financial Health, Market Positioning, Profitability, Payout
- Past Performance — Business Growth, Profit Improvement, Positioning, Momentum, Outlook
- Growth — Business Growth, Profit Improvement, Positioning, Outlook
- Value — Pricing, Outlook, Payout, Market Positioning
- Risk — standalone measure of volatility, leverage, and drawdown indicators
9 Component Scores
Financial Health
Debt ratios, current ratio, interest coverage. Can the company weather a downturn?
Business Growth
Revenue expansion velocity, market share gains, geographic and product-line growth.
Profit Improvement
Margin expansion, earnings acceleration, operating leverage. Bottom line growing faster than top line?
Market Positioning
Competitive moat, pricing power, brand strength, and market leadership status.
Profitability
Gross, operating, and net margins. ROE, ROIC, and free cash flow conversion.
Payout
Dividend yield, payout ratio, buyback activity. Returning cash without over-leveraging.
Outlook
Analyst earnings revisions, consensus trends, forward estimates. Is the street getting more bullish?
Pricing
P/E, P/S, P/B, EV/EBITDA vs historical averages and peer medians. Cheap or expensive relative to context.
Momentum
Relative strength, price trends, technical indicators. Is the market already voting with its feet?
Reading Score Combinations
Scores tell you more in combination than isolation. High Business Quality + high Value = a quality company trading at a discount. High Growth + low Value = the growth story is already priced in. High Past Performance + low Momentum = a recent pullback in an otherwise solid performer.
Drill into components when main scores look contradictory — the answer is usually one or two factors dragging the aggregate. Scores update as new financial data, price movements, and analyst estimates come in.
Valuation Methodology
Four independent models. Percentile distributions instead of point estimates. Convergence as a conviction signal.
Ensemble Approach
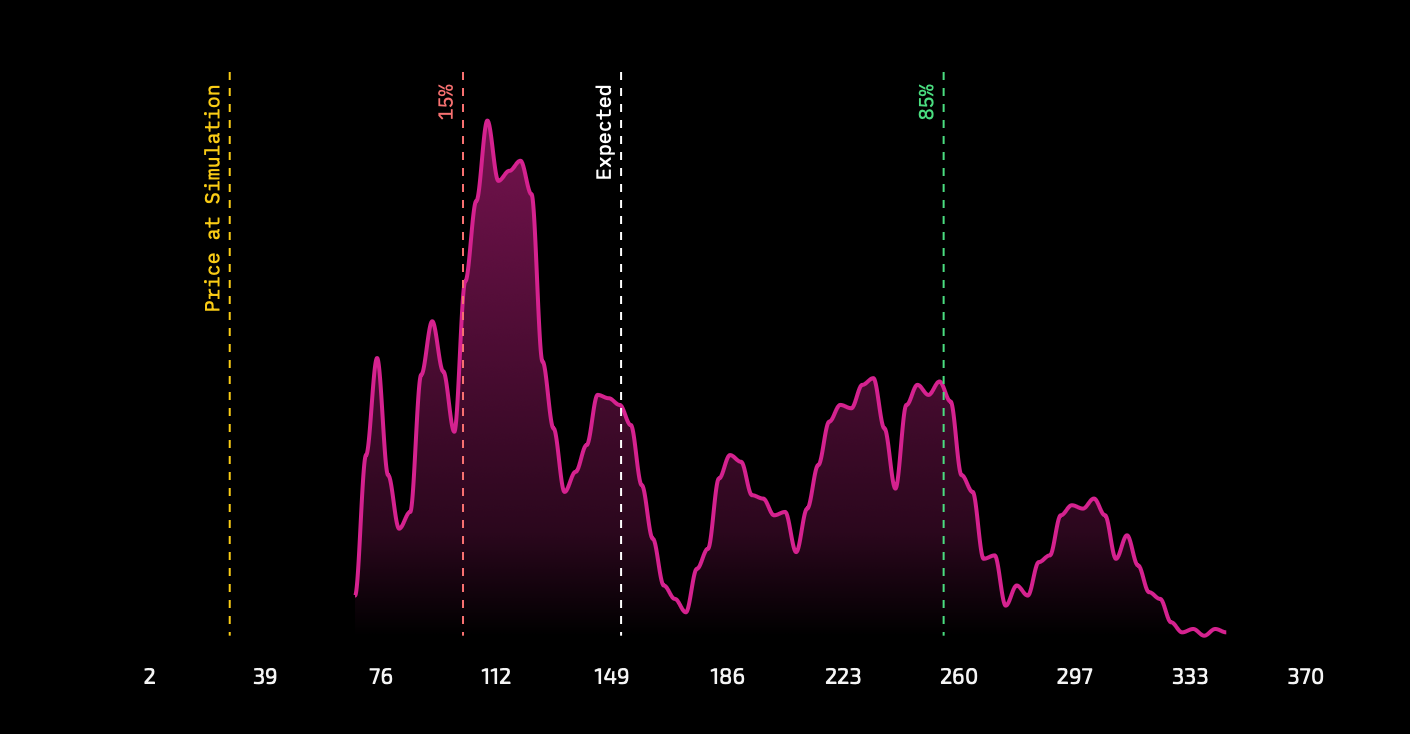
Each model approaches the same company from a different angle — peer multiples, thematic positioning, factor profile, and manual assumptions. They run independently, each generating thousands of simulated outcomes that account for revenue path uncertainty, margin variability, and terminal value sensitivity. When outputs converge, conviction goes up. When they diverge, you've found a quality premium, a sector dislocation, or a narrative gap worth investigating.
Every model outputs three percentile targets — 15th (bear), 50th (base), 85th (bull) — with implied upside from current price and multi-year CAGRs. You see the full distribution, not just a single number.
How Each Model Works
- Theme model — Uses thematic peer sets (narrative similarity, shared price action) to derive multiples. Captures valuation premiums driven by market perception rather than fundamentals alone. Only available when a thematic peer group exists for the company.
- Industry model — Derives fair value from sector peer median multiples (P/E, P/S, EV/EBITDA), adjusted for growth and margin profiles. Outlier exclusion removes extreme peers that would distort the range.
- Scores model — Sector-agnostic. Uses a trained quantitative model to value the company based on its full Zenith Scores profile and cross-sector factor relationships. An adjustable risk slider controls the risk premium applied to the output.
- Custom model — Manual assumptions. Set your own P/S, P/E, and P/OCF multiples, revenue growth, net margin, and cash flow margin targets. No peer dependency, no model opinion.
Cross-Model Validation
The point of running four models is disagreement. If Theme and Industry outputs align but Scores diverges, you may have found a quality premium the market hasn't priced. If all four converge on modest upside, the opportunity may not justify the position. 50%+ upside with reasonable assumptions across models suggests material mispricing.